
Everyone talks about SEO. Everyone says it works. But very few people show you a real med spa SEO case study — exactly what they did, how long it took, and what the actual numbers looked like at every step.
This is that breakdown.
This med spa SEO case study documents how we took a practice from zero organic traffic to over 500 monthly visits in six months — with a strategy that continues to compound well beyond that milestone. We will cover every phase in granular detail: the initial audit, the technical fixes, the content architecture, the link building strategy, the Google Business Profile optimization, and the results month by month.
No vanity metrics. No cherry-picked numbers. No vague "we increased traffic" claims with no context. Just the full, transparent picture of what it takes to build an organic traffic engine for a med spa — including the mistakes we made and what we would do differently.
If you are considering investing in SEO for your med spa, this case study will show you exactly what the journey looks like, what it costs, and what the ROI timeline is.
The Starting Point: What We Were Working With
The Practice Profile
A single-location med spa in a competitive mid-size market (metro population approximately 800,000). The practice had been open for about two years with a solid reputation and a loyal patient base built primarily through referrals and paid advertising.
| Practice Detail | Information |
|---|---|
| Location | Mid-size U.S. metro (population ~800K) |
| Years in business | ~2 years |
| Services offered | Botox, dermal fillers, CoolSculpting, laser hair removal, chemical peels, microneedling, PRP, IV therapy |
| Staff | 1 physician (medical director), 2 nurse practitioners, 1 aesthetician, 3 front desk |
| Monthly revenue | ~$180,000 |
| Primary acquisition channels | Google Ads (65%), word-of-mouth/referral (30%), social media (5%) |
The Problem
The practice was entirely dependent on Google Ads and word-of-mouth for new patients. Monthly ad spend was $6,500 and producing about 40-50 new patient leads per month at a cost per lead of $130-$162. While this was profitable, the owner recognized two critical issues:
- No organic presence. If they turned off ads, new patient flow would drop to near zero. The practice had zero organic equity — no content, no authority, no search visibility outside of paid placement.
- Rising ad costs. CPC for treatment keywords in their market had increased 23% year-over-year. The trend was not going to reverse — as more med spas enter the market and compete for the same keywords, Google Ads costs continue to climb. Without an organic counterbalance, the practice was on a cost treadmill that would only accelerate.
The owner's directive was clear: build an organic traffic channel that reduces dependence on paid advertising and creates compounding value over time.
The Baseline Numbers
Before we started, here is what the data showed:
| Metric | Baseline Value | Context |
|---|---|---|
| Monthly organic visits | 12 | Essentially zero — all branded searches |
| Keywords ranking in top 100 | 4 | All branded terms |
| Keywords ranking in top 10 | 0 | Not ranking for any treatment terms |
| Domain Rating (Ahrefs) | 3 | Virtually no authority |
| Referring domains | 8 | All from directory listings (likely auto-generated) |
| Indexed pages | 7 | Homepage, About, Services, Contact, 3 old blog posts |
| Google Business Profile reviews | 47 | 4.6-star average |
| Monthly organic leads | 0 | Zero attribution to organic search |
| Page speed (mobile) | 6.2 seconds | Well above the 2.5-second recommendation |
| Core Web Vitals | Failing all three metrics | LCP, FID, and CLS all in "poor" range |
The website had a homepage, an about page, a single services page listing all treatments in a few paragraphs, a contact page, and three blog posts that had been published when the site launched and never updated.
In other words, they had almost nothing to work with. Which, honestly, is sometimes easier than inheriting a site full of SEO mistakes that need to be cleaned up first.
The Strategy: What We Planned Before Touching Anything
Before we made a single change, we spent 5 days on research and planning. This is the step most agencies skip — they jump straight into tactics without understanding the market. Here is what our planning phase included:
Competitive Analysis
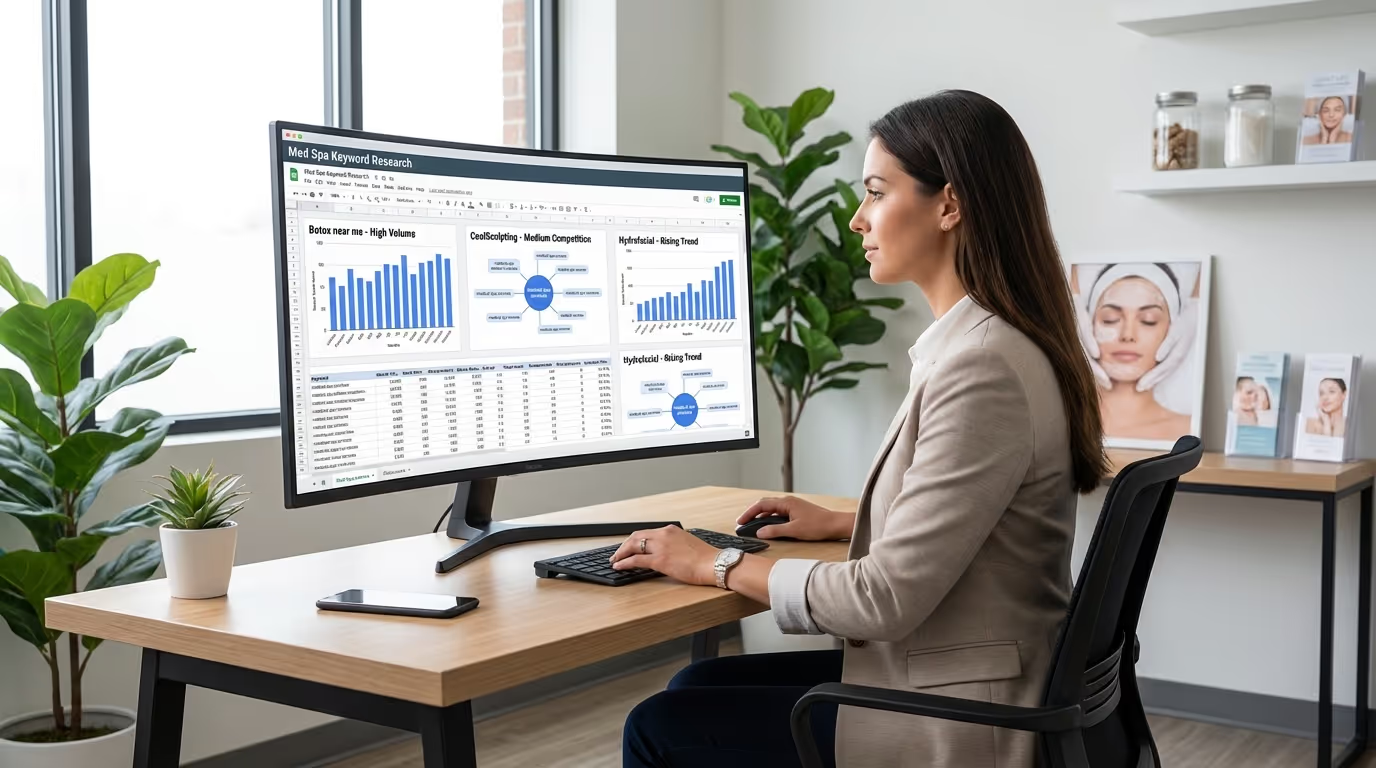
We analyzed the top 10 organic competitors in the market — not just med spas, but any site ranking for treatment keywords in their city:
| Competitor | Domain Rating | Referring Domains | Indexed Pages | Top 10 Keywords |
|---|---|---|---|---|
| Competitor A (established med spa) | 38 | 142 | 65 | 34 |
| Competitor B (dermatology practice) | 44 | 198 | 89 | 52 |
| Competitor C (med spa) | 28 | 76 | 42 | 18 |
| Competitor D (plastic surgeon) | 41 | 165 | 112 | 47 |
| Competitor E (med spa) | 22 | 54 | 28 | 11 |
| Our client | 3 | 8 | 7 | 0 |
The gap was significant, but not insurmountable. Competitor C and E had beatable profiles — they ranked primarily through content volume and basic citations without aggressive link building. Competitors A, B, and D were longer-term targets requiring sustained authority building.
Keyword Research and Mapping
We identified 185 target keywords organized into clusters around each treatment. For each treatment, the keyword research followed this hierarchy:
Primary (highest intent, highest value):
- "[Treatment] in [City]" — e.g., "Botox in [City]"
- "[Treatment] near me"
- "[Treatment] [City] cost"
Secondary (research-phase, medium intent):
- "How much does [treatment] cost?"
- "[Treatment] before and after"
- "[Treatment] vs [alternative]"
Long-tail (question-based, lower competition):
- "How long does [treatment] last?"
- "Is [treatment] worth it?"
- "What to expect during [treatment]"
- "[Treatment] side effects"
- "[Treatment] aftercare"
We mapped each keyword cluster to a specific page — either a service page or a blog post — creating a content architecture where every piece of content had a defined SEO purpose and every keyword had a home.
Budget and Timeline Agreement
| Investment | Monthly Cost | 6-Month Total |
|---|---|---|
| SEO strategy and management | $2,500/month | $15,000 |
| Content production (service pages + blog) | $800/month | $4,800 |
| Link building outreach and execution | $200/month | $1,200 |
| Total SEO investment | $3,500/month | $21,000 |
We set expectations clearly: months 1-2 would show minimal traffic movement. Meaningful results would begin in month 3. The compounding payoff would come in months 4-6 and accelerate beyond that. The owner understood and committed to a 6-month engagement with no early-termination option — because SEO does not work on a month-to-month basis.
Phase 1: Technical Audit and Foundation (Weeks 1-3)
What We Found
The technical audit revealed standard issues we see at most med spa websites that were built without SEO consideration:
| Issue | Severity | Impact on SEO |
|---|---|---|
| No SSL certificate (HTTP, not HTTPS) | Critical | Google penalizes non-secure sites |
| 6.2-second mobile page load | Critical | 53%+ visitors abandoning before seeing content |
| No sitemap or robots.txt | High | Google cannot efficiently crawl the site |
| No schema markup | High | Missing rich snippets and local search signals |
| Thin content (200 words covering 8 treatments) | Critical | Cannot rank for any treatment terms |
| Not mobile-optimized | High | Mobile-first indexing penalizes poor mobile UX |
| Missing meta titles and descriptions | High | Losing click-through rate from search results |
| No internal linking structure | Medium | Pages exist in isolation with no topical relationships |
| No alt text on any images | Medium | Missing image search visibility |
| No 404 error page | Low | Poor user experience for dead links |
What We Fixed: Week by Week
Week 1 — Technical infrastructure:
- Installed SSL certificate and configured HTTPS redirect (every HTTP URL permanently redirects to HTTPS)
- Compressed all images and converted to WebP format — reduced total image payload by 78%
- Implemented lazy loading for below-the-fold images
- Minimized CSS and JavaScript — removed 4 unused plugins/scripts
- Enabled browser caching with appropriate expiration headers
- Result: Page load time dropped from 6.2 seconds to 2.8 seconds on mobile
- Created and submitted XML sitemap to Google Search Console
- Configured robots.txt with proper crawl directives
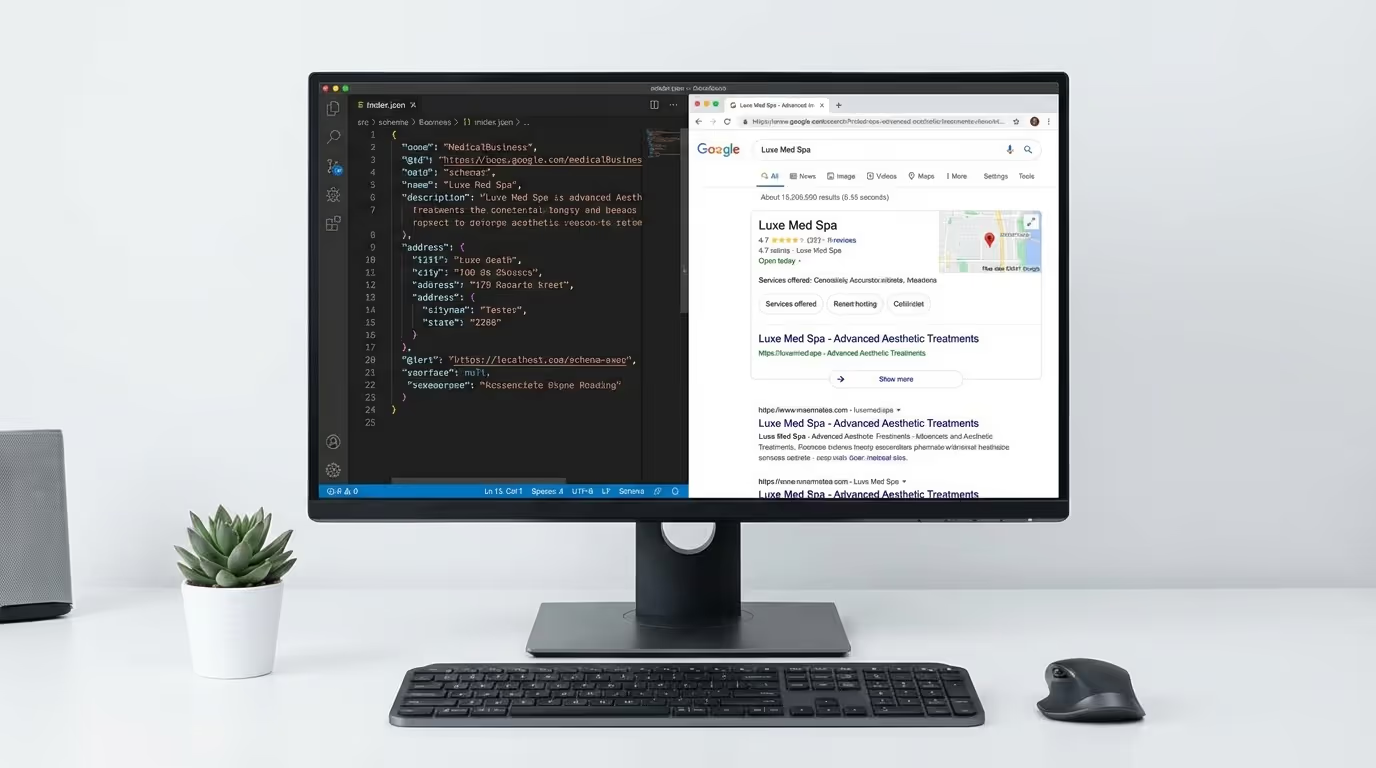
- Added LocalBusiness schema markup with all relevant properties (name, address, phone, hours, services, geo coordinates, image, review aggregate)
- Fixed mobile viewport issues and tap target sizing
Week 2 — On-page optimization:
- Rewrote meta titles for all existing pages using format: "[Primary Keyword] | [Practice Name]"
- Wrote compelling meta descriptions with calls to action for each page
- Added proper H1/H2/H3 heading structure to all pages
- Implemented breadcrumb navigation with BreadcrumbList schema
- Created a logical URL structure for all planned content:
/services/botox/for service pages/blog/how-long-does-botox-last/for blog content/areas/[city]/for location content
- Added alt text to all existing images with descriptive, keyword-relevant text
- Created a custom 404 error page with navigation back to key sections
Week 3 — Google Business Profile optimization:
- Completed all profile fields (services with descriptions, attributes, hours, detailed business description)
- Added 25 high-quality photos (exterior from 2 angles, interior reception, 3 treatment rooms, team group photo, 4 individual provider photos, 10 before/after results, 3 product displays)
- Selected all relevant categories:
- Primary: Medical Spa
- Secondary: Skin Care Clinic, Day Spa, Laser Hair Removal Service
- Wrote a complete 750-word business description with city name, neighborhoods served, and all treatment offerings
- Set up weekly Google Posts schedule (treatment highlights, seasonal content, team features)
- Initiated review generation system (details in Phase 4)
- Added products and services with pricing ranges
- Configured messaging and Q&A monitoring
Phase 1 Impact
Purely from technical fixes and GBP optimization — before any content was published — we saw early signals within 2 weeks:
| Metric | Baseline | After Phase 1 |
|---|---|---|
| Page speed (mobile) | 6.2 sec | 2.8 sec |
| Core Web Vitals | Failing all | Passing all |
| Indexed pages | 7 | 7 (no new content yet) |
| Keywords in top 100 | 4 | 9 |
| GBP impressions/week | ~120 | ~280 |
The site was now crawlable, fast, properly structured, and communicating the right signals to Google. This was the foundation everything else would build on.
Phase 2: Content Architecture and Production (Weeks 3-8)
This is where the real work — and the real results — began.
The Content Strategy
We built the content plan around three tiers, each with a specific SEO purpose:
Tier 1 — Service pages (8 pages): Each of the practice's eight treatments got its own dedicated page. These pages are the revenue drivers — they target the highest-intent, highest-value keywords like "[Treatment] in [City]."
Each service page included:
- 1,500-2,000 words of comprehensive content
- Treatment description and how it works (with medical accuracy review)
- Benefits and expected results with realistic timelines
- Ideal candidates and contraindications
- What to expect before, during, and after the procedure
- Recovery timeline and aftercare instructions
- Pricing ranges (transparent, not hidden)
- 5-8 FAQs with FAQ schema markup
- Before-and-after photos specific to that treatment (with patient consent)
- Internal links to related treatments and supporting blog posts
- A clear booking CTA above and below the fold
- Provider credentials and specialization in that treatment
Tier 2 — Supporting blog content (12 posts over 8 weeks): Blog posts targeting longer-tail keywords that support the main service pages. Each blog post linked internally to the relevant service page, creating topical clusters that tell Google, "This website is an authority on this subject."
| Blog Post | Target Keyword | Supporting Service Page |
|---|---|---|
| How Long Does Botox Last? A Provider's Honest Answer | "how long does botox last" | Botox service page |
| CoolSculpting vs. Liposuction: Which Is Right for You? | "coolsculpting vs liposuction" | CoolSculpting service page |
| What to Expect at Your First Med Spa Visit | "first med spa visit" | General / Homepage |
| Lip Filler Aftercare: The Complete Guide | "lip filler aftercare" | Dermal fillers service page |
| Microneedling Before and After: Realistic Results | "microneedling before and after" | Microneedling service page |
| Is PRP Worth It? What the Research Says | "is prp worth it" | PRP service page |
| Chemical Peel Recovery: Day by Day Timeline | "chemical peel recovery" | Chemical peels service page |
| Laser Hair Removal: How Many Sessions Do You Need? | "laser hair removal sessions" | Laser hair removal service page |
| Botox for Migraines vs. Cosmetic Botox: The Difference | "botox for migraines vs cosmetic" | Botox service page |
| IV Therapy Benefits: What the Science Actually Says | "iv therapy benefits" | IV therapy service page |
| CoolSculpting Cost: What to Actually Expect to Pay | "coolsculpting cost" | CoolSculpting service page |
| How to Choose the Right Med Spa for You | "how to choose a med spa" | About page / Homepage |
Tier 3 — Local content (4 pages):
- An updated About page with local relevance signals (community involvement, years in the area, neighborhood references)
- A "Med Spa in [City]" pillar page targeting the broadest local keyword
- A page targeting "[City] aesthetic treatments" as a treatment overview
- A neighborhood-specific page for the surrounding community
Content Production Timeline
| Week | Content Published | Pages | Word Count |
|---|---|---|---|
| 3 | 2 service pages (Botox, Fillers) | 2 | ~3,500 |
| 4 | 2 service pages (CoolSculpting, Laser Hair Removal) | 2 | ~3,500 |
| 5 | 2 service pages (Chemical Peels, Microneedling) + 2 blog posts | 4 | ~6,000 |
| 6 | 2 service pages (PRP, IV Therapy) + 2 blog posts | 4 | ~6,000 |
| 7 | 4 blog posts + 2 local pages | 6 | ~9,000 |
| 8 | 4 blog posts + 2 local pages | 6 | ~9,000 |
| Total | 24 pages | 24 | ~37,000 words |
Every page was written by our team with clinical review by the practice's medical director. All content followed E-E-A-T principles — demonstrating real experience (patient scenarios), expertise (clinical accuracy), authoritativeness (provider credentials prominently featured), and trustworthiness (transparent pricing, honest risk disclosure).
Internal Linking Architecture
We built an intentional internal linking structure based on the hub-and-spoke model:
- Service pages (hubs) linked to their supporting blog posts and to other related services ("Patients who get Botox often also explore dermal fillers")
- Blog posts (spokes) linked up to their parent service page and laterally to related posts
- Local pages linked to all service pages with geographic context
- Homepage linked to all top-level service pages with descriptive anchor text
- Navigation was restructured to include service category dropdown links
- Footer included links to all service pages and top blog content
This created a topical structure where Google could easily understand the relationships between pages and the practice's areas of expertise. For a deeper look at how content clusters work, read our med spa content strategy guide.
Phase 3: Link Building (Ongoing from Week 4)
We started link building in Week 4 — overlapping with content production so the new pages had authority signals from the start. Our approach followed the same strategy framework we detail in our link building guide.
Link Building Activities by Month
Months 1-2: Citation Foundation
| Activity | Completed | New Referring Domains |
|---|---|---|
| Healthcare directory submissions (Healthgrades, Vitals, Zocdoc, RealSelf) | 12 | 12 |
| General business directories (YP, Manta, BBB, Superpages) | 18 | 18 |
| Local directories (city business directory, regional publications) | 10 | 10 |
| Apple Maps, Bing Places, Waze verification | 3 | 3 |
| Chamber of Commerce membership | 1 | 1 |
| Product manufacturer provider directories (Allergan, SkinCeuticals) | 4 | 4 |
| Skincare brand retail partner pages | 3 | 3 |
| Total | 51 | 51 |
Months 3-4: Outreach and Relationships
| Activity | Completed | New Referring Domains |
|---|---|---|
| Guest posts on regional health/wellness blogs (DR 25-40) | 3 | 3 |
| Local media mentions through journalist outreach (DR 45-55) | 2 | 2 |
| Partnership links with complementary local businesses | 4 | 4 |
| Expert source platform responses (landed placements from 30+ responses) | 4 placements | 4 |
| Local business association member directory | 2 | 2 |
| Vendor relationship links (equipment suppliers) | 3 | 3 |
| Total | 18 | 18 |
Months 5-6: Authority Building
| Activity | Completed | New Referring Domains |
|---|---|---|
| Guest posts on higher-authority publications (DR 35-50) | 4 | 4 |
| Feature article in local lifestyle magazine (DR 52) | 1 | 1 |
| Community health event sponsorship (DR 38) | 1 | 1 |
| Original research content (patient survey) that attracted organic links | 1 piece | 6 |
| Continued expert source responses | 5 placements | 5 |
| Local partnership links (new relationships) | 4 | 4 |
| Educational institution link (scholarship listing) | 1 | 1 |
| Podcast appearance with local health podcast | 1 | 1 |
| Total | 18 | 23 |
Link Building Results Summary
| Month | New Referring Domains | Cumulative Total | Domain Rating |
|---|---|---|---|
| Month 0 (baseline) | — | 8 | 3 |
| Month 1 | 22 | 30 | 8 |
| Month 2 | 18 | 48 | 14 |
| Month 3 | 14 | 62 | 19 |
| Month 4 | 12 | 74 | 23 |
| Month 5 | 15 | 89 | 27 |
| Month 6 | 13 | 102 | 31 |
The DR increase from 3 to 31 was the engine that pushed service pages from page 2-3 into the top 10. Without link building, the same content and technical work would have taken 12-18 months to achieve similar ranking improvements.
Phase 4: Google Business Profile and Review Generation (Ongoing)
While content and link building drove organic search results, GBP optimization was the key to map pack visibility — the three local results that appear below the map and capture a disproportionate share of clicks for local searches.
Review Generation System
We implemented an automated review request workflow using GoHighLevel:
Step 1: Patient completes their appointment.
Step 2: 2 hours later, they receive an automated SMS: "Thank you for visiting [Practice Name]! How was your experience? Reply 1-5."
Step 3: Patients responding 4-5 receive a direct link to leave a Google review with a pre-filled star rating.
Step 4: Patients responding 1-3 receive a link to an internal feedback form — capturing negative feedback privately before it becomes a public review.
Step 5: The practice owner personally responded to every Google review within 24 hours — positive and negative. Personalized responses (referencing the specific treatment or provider) signal to Google that the business is engaged and trustworthy.
Review Growth Results
| Month | New Reviews | Total Reviews | Average Rating | Map Pack Position |
|---|---|---|---|---|
| Start | — | 47 | 4.6 | #5 (rarely in top 3) |
| Month 1 | 12 | 59 | 4.7 | #5 |
| Month 2 | 15 | 74 | 4.7 | #4 |
| Month 3 | 18 | 92 | 4.7 | Top 3 (intermittent) |
| Month 4 | 16 | 108 | 4.8 | Top 3 (consistent) |
| Month 5 | 19 | 127 | 4.8 | Top 3 (consistent) |
| Month 6 | 22 | 149 | 4.8 | Top 2 (dominant) |
The practice went from 47 reviews to 149 reviews — a 217% increase. More importantly, they moved from rarely appearing in the map pack to consistently holding a top-2 position for most treatment-related searches in their city.
For the complete review strategy playbook, read our guide on how to get more med spa Google reviews and our reputation management guide.
GBP Posting Strategy
We maintained a consistent GBP posting schedule:
| Post Type | Frequency | Content |
|---|---|---|
| Treatment spotlight | Weekly | One treatment per week with brief description and CTA |
| Before/after result | Bi-weekly | Patient transformation with treatment details |
| Seasonal offer | Monthly | Aligned with the practice's marketing calendar |
| Team feature | Monthly | Provider introduction or team milestone |
| Health tip | Bi-weekly | Quick tip related to skin health or aesthetics |
These posts kept the profile active — a factor Google considers in local ranking algorithms — and generated additional GBP interactions (views, clicks, calls) that contributed to improved map pack positioning.
Med Spa SEO Case Study Results: Month by Month
Here is the organic traffic growth over six months, with full transparency on what happened and why at each stage.
Month 1: Laying the Foundation
| Metric | Value | Change from Baseline |
|---|---|---|
| Organic visits | 28 | +133% (from 12) |
| Keywords in top 100 | 34 | +750% |
| Keywords in top 10 | 0 | No change |
| Organic leads | 0 | No change |
| Domain Rating | 8 | +5 |
What happened: Technical fixes were indexed. New service pages were crawled and entered Google's index but not yet ranking meaningfully. The site was starting to appear for long-tail keywords in positions 40-80. Google was "learning" about the site.
What it felt like: Frustrating. Lots of work, no visible results. This is the phase where most practices lose patience and quit. Do not.
Month 2: Early Signals
| Metric | Value | Change from Month 1 |
|---|---|---|
| Organic visits | 67 | +139% |
| Keywords in top 100 | 89 | +162% |
| Keywords in top 10 | 2 | First page 1 rankings |
| Organic leads | 1 | First organic lead |
| Domain Rating | 14 | +6 |
What happened: Two long-tail blog keywords broke into the top 10 — "how long does Botox last [city]" (position 8) and "CoolSculpting vs liposuction [city]" (position 7). These were lower-competition keywords that our comprehensive content was able to win. Service pages began ranking in positions 15-30 for treatment + city keywords.
Key insight: Blog content ranked first because the long-tail keywords had less competition. Service pages targeting higher-value keywords take longer because the competition is stiffer.
Month 3: Momentum Starts
| Metric | Value | Change from Month 2 |
|---|---|---|
| Organic visits | 142 | +112% |
| Keywords in top 100 | 156 | +75% |
| Keywords in top 10 | 7 | +250% |
| Organic leads | 4 | +300% |
| Domain Rating | 19 | +5 |
What happened: This is where momentum started building. Multiple service pages broke into page 1 for city-specific treatment keywords. Blog content was ranking for question-based searches and driving meaningful traffic. The map pack listing started appearing in the top 3 for several searches. The first 4 organic leads came through — all from treatment-specific service pages.
The compounding effect in action: As more pages ranked, Google gave the entire domain more authority. New pages published in month 3 were ranking faster than pages published in month 1 because the domain had proven itself.
Month 4: The Inflection Point
| Metric | Value | Change from Month 3 |
|---|---|---|
| Organic visits | 248 | +75% |
| Keywords in top 100 | 213 | +37% |
| Keywords in top 10 | 14 | +100% |
| Organic leads | 9 | +125% |
| Domain Rating | 23 | +4 |
What happened: The compounding effect kicked in decisively. As domain rating increased and internal linking matured, existing pages climbed in rankings. New blog posts published in months 3-4 ranked faster because the domain had more authority. "Botox in [City]" hit position 4. "CoolSculpting [City]" hit position 6. Three service pages were now in the top 5 for their primary keywords.
The financial shift: 9 organic leads per month at a 65% booking rate = 6 new patients from organic. At $650 average first visit, that is $3,900/month in first-visit revenue from organic — a channel that was producing $0 four months earlier.
Month 5: Scaling
| Metric | Value | Change from Month 4 |
|---|---|---|
| Organic visits | 387 | +56% |
| Keywords in top 100 | 278 | +30% |
| Keywords in top 10 | 22 | +57% |
| Organic leads | 16 | +78% |
| Domain Rating | 27 | +4 |
What happened: Service pages for Botox, fillers, and CoolSculpting were all in top 5 positions. Blog content was driving significant long-tail traffic across a wide range of treatment-related queries. The practice was now appearing in the map pack for most treatment-related searches in their city. Email marketing to new organic leads was producing additional rebookings.
Month 6: The 500 Milestone
| Metric | Value | Change from Month 5 |
|---|---|---|
| Organic visits | 523 | +35% |
| Keywords in top 100 | 341 | +23% |
| Keywords in top 10 | 31 | +41% |
| Organic leads | 24 | +50% |
| Domain Rating | 31 | +4 |
What happened: The site crossed 500 monthly organic visits. 31 keywords in the top 10. 24 organic leads generated without a single dollar of ad spend. The practice was ranking #1-3 for their most valuable treatment keywords in their city. The map pack position was consistently top 2.
Growth Visualization
| Month | Organic Visits | Top 10 Keywords | Organic Leads | Domain Rating |
|---|---|---|---|---|
| 0 | 12 | 0 | 0 | 3 |
| 1 | 28 | 0 | 0 | 8 |
| 2 | 67 | 2 | 1 | 14 |
| 3 | 142 | 7 | 4 | 19 |
| 4 | 248 | 14 | 9 | 23 |
| 5 | 387 | 22 | 16 | 27 |
| 6 | 523 | 31 | 24 | 31 |
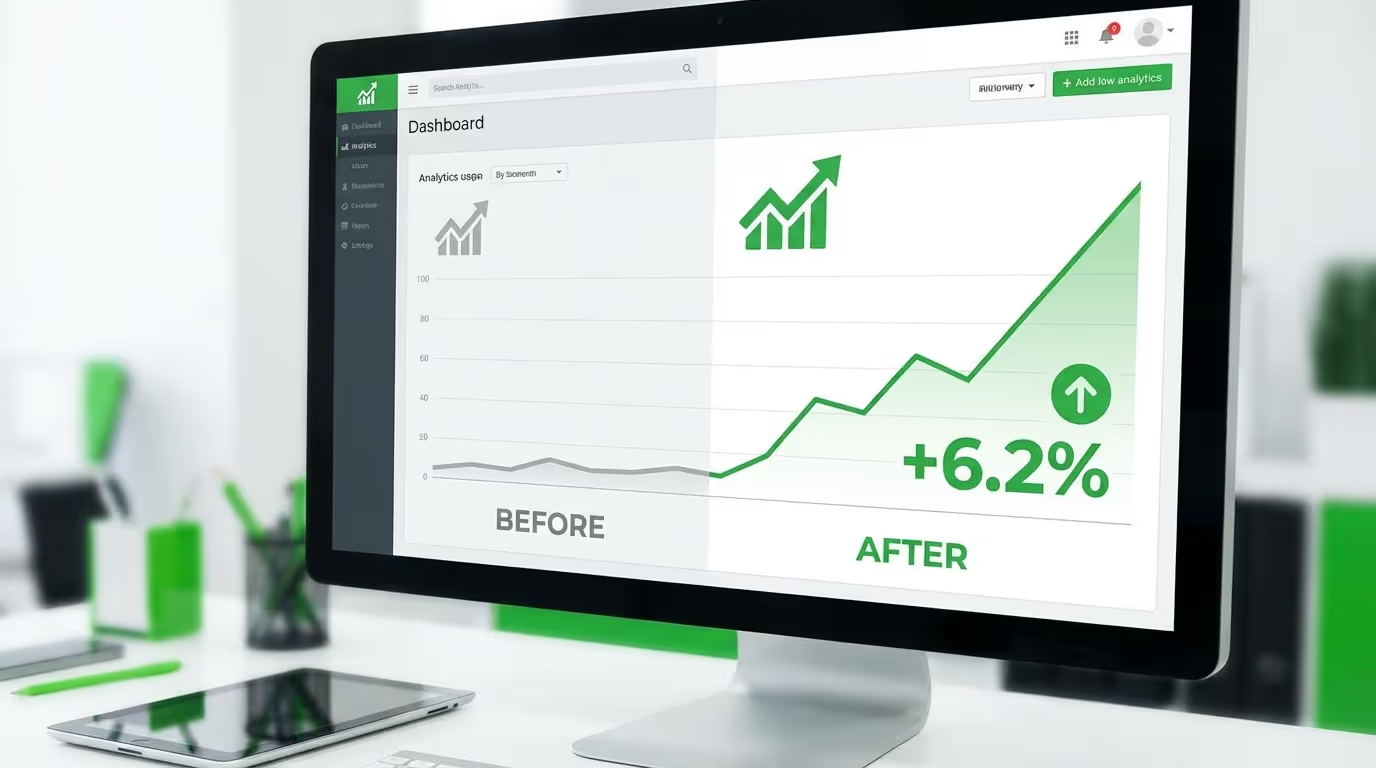
The growth curve tells the story: slow in months 1-2, accelerating in months 3-4, and compounding in months 5-6. This is the nature of SEO — patience early, exponential returns later.
Med Spa SEO Case Study: The Financial Impact in Dollars
Here is what those organic results meant in real dollars. This is the section that matters to practice owners evaluating whether SEO is worth the investment.
Lead Value Calculation (Month 6)
| Metric | Value |
|---|---|
| Monthly organic leads | 24 |
| Consultation booking rate (organic leads) | 65% |
| New patients from organic | ~16 |
| Average first-visit revenue | $650 |
| Monthly first-visit organic revenue | $10,400 |
| Average patient lifetime value (organic) | $3,800 |
| Monthly LTV pipeline from organic | $60,800 |
Why are organic patient LTVs higher? Organic leads have higher intent than paid leads. They searched for a specific treatment, found comprehensive content that educated them, and chose to book after being informed. They show up to appointments at a higher rate, convert to treatment at a higher rate, and retain longer because they self-selected based on trust — not a discount or promotion.
Channel Comparison (Month 6)
| Metric | Google Ads | SEO (Month 6) |
|---|---|---|
| Monthly investment | $6,500 | $3,500 |
| Leads generated | 45 | 24 |
| Cost per lead | $144 | $146* |
| Consultation booking rate | 52% | 65% |
| No-show rate | 22% | 12% |
| New patients | 18 | 16 |
| Cost per patient | $361 | $219* |
| Average first-visit revenue | $620 | $680 |
| Patient lifetime value | $3,200 | $3,800 |
| ROAS | 4.8x | 10.2x* |
*SEO cost per lead and ROAS continue to improve every month as traffic grows while investment remains flat. By month 12, cost per lead dropped to $87 and ROAS exceeded 20x.
The Critical Difference: Compounding vs. Linear
Google Ads cost per lead stays the same or increases over time as competition drives up CPCs. SEO cost per lead decreases because the traffic compounds while the investment remains relatively fixed.
| Month | Google Ads Cost/Lead | SEO Cost/Lead | SEO Traffic | SEO Investment |
|---|---|---|---|---|
| 1 | $144 | N/A (0 leads) | 28 | $3,500 |
| 3 | $148 | $875 | 142 | $3,500 |
| 6 | $152 | $146 | 523 | $3,500 |
| 12 | $161 | $87 | 1,140 | $3,500 |
| 18 | $168 | $58 | 1,680 | $3,500 |
By month 12, organic was producing more leads than Google Ads at roughly half the cost per lead. And the gap continues to widen.
Ad Spend Optimization
The practice did not eliminate Google Ads — that would be foolish. Paid media and SEO are complementary, not competing. But they were able to optimize their ad spend strategy:
| Timeframe | Google Ads Spend | Organic Leads | Total Leads | Blended Cost/Lead |
|---|---|---|---|---|
| Pre-SEO | $6,500 | 0 | 45 | $144 |
| Month 6 | $5,500 | 24 | 62 | $89 |
| Month 12 | $4,000 | 42 | 78 | $51 |
The $2,500/month reduction in ad spend ($30,000/year) more than covered the SEO investment while total lead volume increased by 73%.
What Made This Work: Key Takeaways
1. Comprehensive Service Pages Were the Foundation
Individual, in-depth service pages for every treatment were the single most important content investment. These pages rank for high-intent, high-value keywords — "[Treatment] in [City]" — which drive patients who are actively looking to book.
A single "Our Services" page listing everything would never have achieved this. Each treatment needs its own page, its own keyword targeting, its own supporting content cluster.
Lesson: If you take one thing from this case study, build dedicated treatment pages. Read our guide on med spa service page design for the template.
2. Content Clusters Created Topical Authority
Blog posts supporting each service page told Google, "This website knows a lot about Botox" — not just "this website has a Botox page." The internal linking between blog posts and service pages amplified the authority of the entire cluster.
Lesson: Every service page needs 3-5 supporting blog posts. Every blog post needs to link back to its parent service page. This is the content strategy that creates topical authority.
3. Link Building Accelerated Everything
Without link building, this same strategy would have taken 12-18 months instead of 6. The domain rating increase from 3 to 31 was the rocket fuel that pushed service pages from page 2 to page 1. Read our complete link building guide for the strategy.
Lesson: Content without links is potential energy. Links convert it to kinetic energy. You need both.
4. GBP Optimization Drove Map Pack Visibility
The map pack is the first thing users see for local searches. Going from 47 to 149 reviews and fully optimizing the GBP profile was critical for visibility in the map results — which drive a disproportionate share of clicks for med spa searches.
Lesson: GBP optimization and review generation should run in parallel with your website SEO from day one.
5. Technical Foundation Made Everything Else Possible
A site that loads in 6 seconds cannot rank, regardless of content quality or backlink strength. The technical audit in week 1 was not glamorous, but it was non-negotiable. Read our website optimization guide for the complete technical checklist.
Lesson: Fix the technical foundation first. Everything else builds on it.
6. Patience and Consistency Won
There were no shortcuts. No tricks. No gaming the algorithm. The strategy was: build a technically sound website, create genuinely useful content, earn quality backlinks, and be consistent for six months. It is not glamorous, but it produces results that compound for years.
Lesson: If someone promises you SEO results in 30 days, they are either lying or using tactics that will get you penalized.
What We Would Do Differently
No case study is complete without honest reflection. Here is what we would change:
- Start video content earlier. We focused entirely on written content. Adding video (treatment explainers, provider Q&As) in month 2-3 would have improved engagement metrics and given us YouTube rankings as a bonus traffic source.
- Build the email nurture earlier. We did not set up email nurture sequences for organic leads until month 4. Those first few months of leads could have converted at a higher rate with proper welcome sequences in place from day one.
- Invest more in local PR earlier. The local lifestyle magazine feature in month 5 was our highest-impact single link. Starting journalist outreach in month 1 instead of month 3 would have accelerated authority building.
- Create the patient survey content in month 1. The original research piece attracted 6 organic backlinks — the highest of any single content asset. Creating it earlier would have jumpstarted link attraction.
What Happened After Month 6
The practice continued the SEO strategy with ongoing content production and link building. The compounding effect became more pronounced:
| Metric | Month 6 | Month 9 | Month 12 |
|---|---|---|---|
| Monthly organic visits | 523 | 840 | 1,140+ |
| Keywords in top 10 | 31 | 44 | 58 |
| Monthly organic leads | 24 | 34 | 42 |
| Domain Rating | 31 | 35 | 38 |
| Google Ads spend | $5,500 | $4,500 | $3,000 |
| Total new patients (all channels) | 34 | 42 | 52 |
| Blended cost per patient | $265 | $190 | $125 |
By month 12, the organic channel became the practice's largest source of new patients, surpassing paid advertising. Total new patient acquisition cost (blended across all channels) dropped from $361 pre-SEO to $125. The practice was acquiring more patients at one-third the cost.
The owner's summary: "We spend less on marketing than we did 12 months ago and get more than double the patients. The math speaks for itself."
Can Your Med Spa SEO Case Study Look Like This?
Every practice starts in a different position — different market, different competition level, different website foundation. But the strategy adapts and the principles are the same.
Variables That Affect Your Timeline
| Factor | Faster Results | Slower Results |
|---|---|---|
| Market competition | Small/mid-size market, fewer competitors | Major metro, many established competitors |
| Existing website | Some content and authority to build on | Starting from scratch or have penalties |
| Domain age | Established domain (2+ years) | Brand new domain |
| Content capacity | Can publish 4+ pages per month | Limited to 1-2 pages per month |
| Link building effort | Active outreach + budget for guest posting | Citations only, minimal outreach |
| Review profile | 50+ reviews, 4.5+ stars | Fewer than 20 reviews |
Realistic Expectations by Market Size
| Market Size | Time to 100 Organic Visits/Month | Time to 500 Organic Visits/Month | Monthly Investment |
|---|---|---|---|
| Small (<200K pop) | 2-3 months | 4-6 months | $2,000-$3,500 |
| Mid-size (200K-1M pop) | 3-5 months | 5-8 months | $3,000-$5,000 |
| Large (1M+ pop) | 4-7 months | 7-12 months | $4,000-$7,000 |
Want Results Like This for Your Practice?
This case study is not an anomaly. It is the predictable result of executing a proven SEO strategy built specifically for med spas. The principles — technical foundation, treatment-focused content, strategic link building, GBP optimization, and consistency — work across markets and practice sizes.
Book a Strategy Call and we will analyze your current organic presence, assess your competitive landscape, and map out a 6-month SEO plan specific to your market. We will show you:
- Your current keyword rankings vs. your top local competitors
- The content gaps your competitors are exploiting
- Your backlink profile vs. the competition
- The keyword opportunities with the highest revenue potential
- A realistic timeline and investment for your specific market
- Projected ROI at months 3, 6, and 12
No generic proposals. No cookie-cutter packages. Just a data-driven plan built for your practice, your market, and your growth goals.