

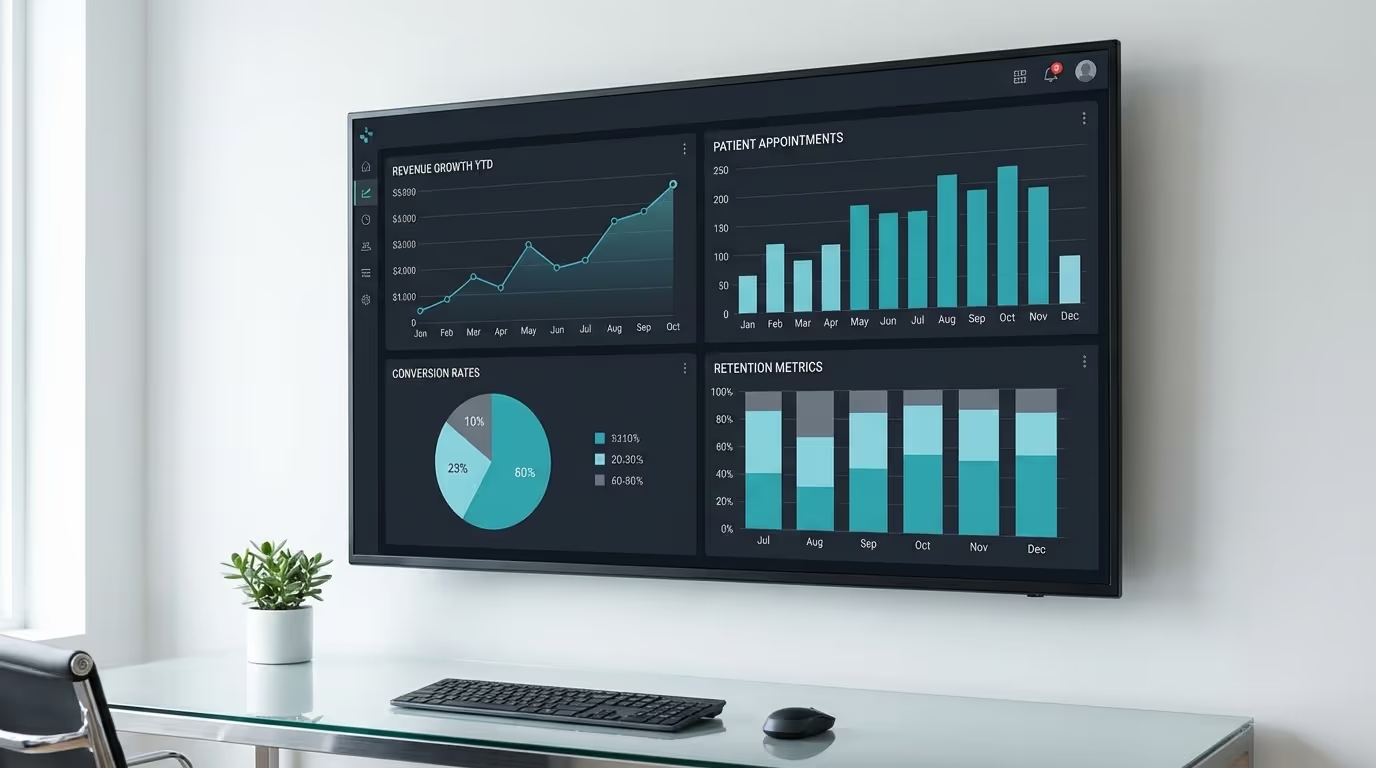
You cannot improve what you do not measure. Tracking the right med spa KPIs is what separates growing practices from stagnating ones. But here is the problem most med spa owners face: they measure everything and understand nothing. Or they measure nothing and wonder why growth stalls.
The average med spa owner can tell you their monthly revenue. Maybe their patient count. Beyond that, the data gets fuzzy. They cannot tell you their revenue per provider hour, their new patient conversion rate, their average patient lifetime value, or their cost per acquisition by channel. These are not vanity metrics — they are the operational intelligence that determines whether your practice scales or stagnates.
We work exclusively with med spas. The owners who consistently grow year over year share one trait: they run their practices on data. Not gut feeling, not "we seem busy," not "I think marketing is working." They know their numbers, they track them weekly, and they make decisions based on what the data tells them.
This guide gives you the complete med spa KPIs framework — 25 med spa metrics organized by category, how to calculate each one, what "good" looks like based on industry benchmarks, implementation steps for building your med spa dashboard, and the diagnostic framework that tells you exactly what to fix when a number is off.
Financial KPIs
These are your foundation. If you track nothing else, track these six metrics.
1. Total Revenue
What it is: Gross revenue collected from all sources — treatments, product sales, membership fees, consultations.
How to track: Pull directly from your POS or EMR system. Track monthly, compare year-over-year and month-over-month.
Benchmarks by practice size:
| Practice Type | Monthly Revenue Range | Annual Revenue Range |
|---|---|---|
| Solo provider | $50,000 – $150,000 | $600K – $1.8M |
| Multi-provider (2-4) | $100,000 – $400,000 | $1.2M – $4.8M |
| Multi-provider (5+) | $300,000 – $800,000+ | $3.6M – $10M+ |
What to watch for: Revenue trending down month-over-month for 2+ consecutive months requires immediate investigation. Seasonal dips (typically January and late summer) are normal but should not exceed 15-20% from your rolling 3-month average.
Common mistake: Tracking revenue without segmenting by source. Break revenue into: treatment revenue, retail/product revenue, membership revenue, and other. This tells you which revenue engines are growing and which are stalling.
2. Revenue Per Provider Hour
What it is: Total treatment revenue divided by total provider clinical hours. This is the single most important efficiency metric in your practice.
How to calculate: Total treatment revenue / Total provider clinical hours (hours in the treatment room, not total hours at work)
Benchmarks:
| Performance Level | Revenue/Hour | What It Means |
|---|---|---|
| Below average | Under $200 | Low-value treatments, excessive downtime, or inefficiency |
| Average | $200 – $350 | Functional but room for significant improvement |
| Good | $350 – $500 | Well-optimized schedule and treatment mix |
| Excellent | $500+ | High-value treatments, full schedule, maximum efficiency |
Implementation steps to improve:
- Analyze your schedule for gaps between patients (target under 10 minutes between appointments)
- Identify which treatments generate the highest revenue per hour and shift provider time toward them
- Delegate non-provider tasks (charting, room setup, patient education) to support staff
- Review treatment duration standards — are providers taking too long on routine procedures?
- Ensure booking software is configured with appropriate appointment lengths
- Train front desk to fill cancellation slots immediately using a waitlist system
3. Average Revenue Per Patient Visit
What it is: Total treatment revenue divided by total patient visits.
How to calculate: Total treatment revenue / Total patient visits (unique visits, not unique patients)
Benchmarks:
| Performance Level | Revenue/Visit | Improvement Lever |
|---|---|---|
| Below average | Under $300 | Missed upsells, low-value service mix |
| Average | $300 – $500 | Standard treatment mix, some upselling |
| Good | $500 – $800 | Effective treatment planning, package/membership structures |
| Excellent | $800+ | Comprehensive plans, premium pricing, strong upselling |
Implementation steps to improve:
- Train providers on comprehensive treatment planning (not single-treatment recommendations)
- Create treatment bundles that combine complementary services at package pricing
- Implement a pre-consultation checklist that identifies all patient concerns
- Review pricing strategy quarterly against market benchmarks
- Add a retail product recommendation to every treatment protocol
- Track this metric by provider to identify training opportunities
4. Gross Profit Margin
What it is: (Revenue - COGS) / Revenue. COGS includes direct treatment costs — products, consumables, and per-treatment equipment costs.
Benchmarks by service type:
| Service Category | Gross Margin Range | Key Cost Driver |
|---|---|---|
| Injectables (Botox, filler) | 60% – 80% | Product cost (injectables) |
| Laser/device treatments | 80% – 95% | Equipment lease/depreciation |
| Chemical peels/facials | 70% – 85% | Product + consumables |
| Retail products | 40% – 60% | Wholesale cost |
| IV therapy | 65% – 80% | IV supplies + vitamins |
| Overall practice | 65% – 80% | Weighted average |
What to watch for: Gross margin declining over time suggests rising product costs, pricing not keeping pace with cost increases, or a shift in service mix toward lower-margin treatments. Run this analysis by treatment category quarterly.
5. Net Profit Margin
What it is: (Total revenue - All expenses) / Total revenue.
Benchmarks:
| Performance Level | Net Margin | Annual Profit on $1.5M Revenue |
|---|---|---|
| Struggling | Under 10% | Under $150,000 |
| Average | 10% – 15% | $150,000 – $225,000 |
| Good | 15% – 20% | $225,000 – $300,000 |
| Excellent | 20% – 30% | $300,000 – $450,000 |
What it reveals: Net profit margin is the ultimate measure of business health. Revenue means nothing without profitability. A practice generating $300,000/month at 10% margin keeps $30,000. A competitor at $200,000/month with 25% margin keeps $50,000.
Common expense buckets to monitor:
| Expense Category | Target % of Revenue | Action if Over Target |
|---|---|---|
| Provider compensation | 25-35% | Review compensation structure, productivity |
| Support staff | 10-15% | Assess staffing ratios, cross-training |
| Rent/occupancy | 8-12% | Renegotiate lease, optimize space utilization |
| Marketing | 8-15% | Audit ROI by channel, cut underperformers |
| Supplies/COGS | 15-25% | Negotiate vendor pricing, join buying groups |
| Technology | 2-4% | Audit software subscriptions, consolidate tools |
| Insurance | 1.5-3% | Annual insurance review |
6. Average Patient Lifetime Value (LTV)
What it is: The total revenue a patient generates over their relationship with your practice.
How to calculate: Average revenue per visit x Average visits per year x Average patient lifespan (in years)
Benchmarks:
| Performance Level | LTV | What It Means |
|---|---|---|
| Low | Under $1,500 | One-time visitors, no retention system |
| Average | $1,500 – $4,000 | Some repeat visits, basic retention |
| Good | $4,000 – $8,000 | Strong retention, membership programs working |
| Excellent | $8,000+ | Exceptional experience, comprehensive treatment plans |
Why LTV is the most important strategic metric: LTV determines how much you can afford to spend acquiring a new patient. If your LTV is $5,000, spending $300 to acquire that patient is a 16.6x return. If your LTV is $800, that same $300 acquisition cost is problematic.
Implementation steps to increase LTV:
- Launch or optimize your membership program — members spend 2-3x more than non-members
- Implement automated rebooking reminders for every treatment type
- Create treatment progression plans (entry treatment → series → maintenance → expansion)
- Build a loyalty program that rewards frequency
- Use email and SMS marketing for ongoing patient communication
- Track LTV by acquisition source to identify which marketing channels bring the highest-value patients
Patient Acquisition Med Spa KPIs
These metrics tell you how effectively you are turning marketing dollars into patients.
7. New Patient Volume
What it is: Number of first-time patients per month.
Benchmarks:
| Practice Type | Monthly New Patients | What Drives It |
|---|---|---|
| Solo provider | 20 – 50 | Google Ads, SEO, referrals |
| Multi-provider | 50 – 150 | Multi-channel marketing |
| High-growth | 150+ | Aggressive marketing + referral program |
Diagnostic: If new patients are flat while marketing spend is increasing, investigate: Is your messaging off? Are channels saturated? Is your conversion process broken? Is the market too competitive?
8. Cost Per Lead (CPL)
What it is: Total marketing spend / Number of leads generated.
Benchmarks by channel:
| Channel | CPL Range | Lead Quality | Volume Potential |
|---|---|---|---|
| Google Ads | $25 – $75 | Highest intent | High |
| Meta Ads | $15 – $50 | Medium intent | Very high |
| SEO/organic | $10 – $30 | High intent | Builds over time |
| Referral program | $0 – $50 | Highest quality | Variable |
| Email/SMS reactivation | $5 – $15 | Known patients | Depends on list |
| Influencer marketing | $50 – $200 | Variable | Low-medium |
What to watch for: CPL increasing over time within a channel suggests ad fatigue, increased competition, or declining ad quality. CPL should decrease as campaigns optimize — if trending up after 3+ months, restructure or reallocate.
9. Cost Per Acquisition (CPA)
What it is: Total marketing spend / Number of new patients who actually booked and showed up.
Benchmarks:
| Performance Level | CPA | Context |
|---|---|---|
| Excellent | Under $100 | Strong conversion rates, efficient channels |
| Good | $100 – $200 | Well-optimized marketing and conversion |
| Average | $200 – $500 | Room for funnel optimization |
| Below average | Over $500 | Significant waste or conversion failure |
Why CPA matters more than CPL: A $30 CPL with a 10% lead-to-patient rate gives you a $300 CPA. A $60 CPL with a 25% rate gives you a $240 CPA. The more expensive leads are the better investment. Always track both.
10. Lead-to-Patient Conversion Rate
What it is: Percentage of leads that become booked, showed-up patients.
Benchmarks:
| Performance Level | Rate | Likely Cause if Below Target |
|---|---|---|
| Below average | Under 15% | Slow follow-up, poor phone skills, booking friction |
| Average | 15% – 25% | Inconsistent follow-up, no nurture sequence |
| Good | 25% – 40% | Systematic follow-up, trained front desk |
| Excellent | 40%+ | Speed-to-lead under 5 min, optimized funnel |
Implementation steps to improve conversion:
- Implement speed-to-lead automation (SMS within 1 minute of lead submission)
- Train front desk on phone conversion scripts
- Build a 14-day nurture sequence for leads who do not book immediately
- Reduce booking friction (online booking, fewer form fields)
- Track calls with call recording/tracking to identify training gaps
- Review and optimize landing pages monthly
11. Marketing ROI
What it is: (Revenue from marketing-acquired patients - Marketing spend) / Marketing spend x 100
Benchmarks:
| Performance Level | ROAS | Marketing Maturity |
|---|---|---|
| Minimum acceptable | 3:1 | New campaigns, learning phase |
| Good | 5:1 – 8:1 | Optimized campaigns, proven channels |
| Excellent | 10:1+ | Mature programs with retention tracking |
Implementation step: Proper attribution is essential. Track patients from marketing channel → lead → consultation → treatment → lifetime spend. Use your CRM, call tracking, and UTM parameters. First-visit revenue alone understates marketing ROI — track 12-month patient spend for true returns. See our marketing ROI guide for the complete framework.
Retention and Loyalty Med Spa Performance Indicators
Acquiring new patients is expensive. Retaining them is profitable. These metrics determine your long-term financial health.
12. Patient Retention Rate
What it is: Percentage of patients who return for at least one additional visit within 12 months.
Benchmarks:
| Performance Level | Rate | Revenue Impact |
|---|---|---|
| Below average | Under 40% | Spending more to replace lost patients than to serve existing ones |
| Average | 40% – 55% | Standard but costly churn |
| Good | 55% – 70% | Healthy practice with room to optimize |
| Excellent | 70%+ | Strong systems, high patient satisfaction |
The Bain & Company insight: Every 5% increase in retention rate translates to 25-95% increase in profitability. If your retention rate is below 50%, fix retention before increasing acquisition spend.
Implementation steps:
- Calculate retention rate by cohort (month of first visit) to identify trends
- Survey lost patients (phone or email) to identify why they left
- Implement post-treatment follow-up sequences for every treatment type
- Launch automated rebooking reminders timed to treatment intervals
- Address the top 3 reasons patients do not return
- Set a 6-month goal to improve retention by 10 percentage points
13. Rebooking Rate
What it is: Percentage of patients who book their next appointment before leaving the practice.
Benchmarks:
| Performance Level | Rate | Implementation |
|---|---|---|
| Below average | Under 30% | No rebooking process exists |
| Average | 30% – 50% | Rebooking offered but not systematic |
| Good | 50% – 70% | Rebooking is part of checkout SOP |
| Excellent | 70%+ | Rebooking is the default, not the exception |
The script that increases rebooking 20-30 percentage points: "Your next [treatment] should be in about [X weeks]. I have [date] at [time] or [date] at [time] — which works better?" This assumptive close makes rebooking the default action at checkout. Train every front desk team member on this.
14. Membership Conversion Rate
What it is: Percentage of active patients enrolled in your membership or loyalty program.
Benchmarks:
| Performance Level | Rate | Revenue Impact |
|---|---|---|
| Below average | Under 10% | Missing major retention and revenue opportunity |
| Average | 10% – 20% | Program exists but underperforming |
| Good | 20% – 35% | Strong program with active enrollment |
| Excellent | 35%+ | Best-in-class retention system |
Why memberships matter: Membership patients spend 2-3x more annually than non-members and have 80%+ retention rates versus 40-50% for non-members. Your membership program is your most powerful retention and revenue tool.
15. Net Promoter Score (NPS)
What it is: Based on "On a scale of 0-10, how likely are you to recommend us?"
How to calculate: % Promoters (9-10) - % Detractors (0-6)
Benchmarks:
| Performance Level | NPS | Action |
|---|---|---|
| Below average | Under 30 | Investigate detractor feedback immediately |
| Average | 30 – 50 | Identify and address top complaints |
| Good | 50 – 70 | Strong satisfaction, optimize the details |
| Excellent | 70+ | Outstanding — protect what works |
Implementation steps:
- Survey every patient 24-48 hours after their visit (automated via CRM)
- Track NPS monthly as a trend, not a snapshot
- Read every detractor response and identify patterns
- Create a response protocol: follow up personally with every detractor within 24 hours
- Celebrate promoters: ask for a Google review, invite to referral program
Operational KPIs
These metrics measure how efficiently your practice runs day to day.
16. Schedule Utilization Rate
What it is: Booked appointments / Available appointment slots x 100
Benchmarks:
| Performance Level | Rate | Revenue Impact |
|---|---|---|
| Below average | Under 70% | Significant idle capacity |
| Average | 70% – 80% | Moderate underutilization |
| Good | 80% – 90% | Healthy utilization with flexibility |
| Excellent | 90%+ | Maximum capacity — consider adding providers |
Diagnostic: Below 80% means marketing is not driving enough patients, your booking process has friction, or your schedule structure does not match demand patterns. Analyze utilization by day of week and time of day to find the gaps.
17. No-Show and Cancellation Rate
What it is: No-shows plus late cancellations (under 24 hours) / Total booked appointments x 100
Benchmarks and revenue impact:
| Rate | Status | Revenue Lost (400 appts/month, $400 avg) |
|---|---|---|
| Under 8% | Excellent | Under $12,800/month |
| 8% – 12% | Acceptable | $12,800 – $19,200/month |
| 12% – 20% | Problematic | $19,200 – $32,000/month |
| Over 20% | Critical | Over $32,000/month |
Implementation steps to reduce no-shows:
- Send automated appointment reminders: SMS 48 hours + 2 hours before
- Require a deposit ($25-$100) — this alone reduces no-shows by 30-50%
- Implement a waitlist system to fill cancellation slots within 1 hour
- Enforce a no-show policy with consequences for repeat offenders
- Track no-show rate by source — leads from some channels no-show more than others
- Offer easy rescheduling (text or online) to convert cancellations into rebookings
Revenue recovery example: Reducing no-shows from 15% to 8% on 400 monthly appointments = 28 additional kept appointments. At $400 average: $11,200/month = $134,400/year recovered without a single additional marketing dollar.
18. Average Wait Time
What it is: Time between scheduled appointment and treatment start.
| Performance Level | Wait Time | Patient Impact |
|---|---|---|
| Excellent | Under 5 minutes | Patients feel valued and respected |
| Good | 5 – 10 minutes | Acceptable with comfortable waiting area |
| Acceptable | 10 – 15 minutes | Some patients begin to get frustrated |
| Problematic | Over 15 minutes | Primary driver of negative reviews |
Wait time is the single biggest driver of negative reviews in med spas. Track it, reduce it, and watch your satisfaction scores improve.
19. Staff Productivity
What it is: Total revenue / Total staff (FTEs)
Benchmarks:
| Performance Level | Revenue/FTE/Month |
|---|---|
| Below average | Under $15,000 |
| Average | $15,000 – $25,000 |
| Good | $25,000 – $40,000 |
| Excellent | $40,000+ |
Marketing-Specific Med Spa KPIs
These metrics evaluate the performance of your marketing channels.
20. Website Conversion Rate
What it is: Website visitors who take a desired action / Total visitors x 100
Benchmarks:
| Performance Level | Rate | Fix If Below Target |
|---|---|---|
| Below average | Under 2% | Website redesign, add CTAs, simplify navigation |
| Average | 2% – 4% | Optimize landing pages, improve mobile experience |
| Good | 4% – 7% | A/B test CTAs, add chat, improve load speed |
| Excellent | 7%+ | Scale traffic to this high-converting site |
For website optimization strategies, see our dedicated guide.
21. Google Business Profile Metrics
What to track and benchmark:
| GBP Metric | Target | Diagnostic If Below |
|---|---|---|
| Profile views/month | 1,000 – 5,000+ | Optimize profile, add photos, post weekly |
| Website clicks from GBP | 100 – 500+/month | Improve business description, add services |
| Direction requests | 50 – 200+/month | Growing local awareness |
| Phone calls from GBP | 30 – 150+/month | Strong local visibility |
| Review count | 100+ at 4.7+ stars | Systematic review strategy |
See our Google My Business optimization guide for implementation.
22. Social Media Engagement Rate
What it is: (Likes + comments + shares + saves) / Total followers x 100
Benchmarks:
| Performance Level | Rate | Context |
|---|---|---|
| Below average | Under 1% | Content is not resonating or audience is not real |
| Average | 1% – 3% | Typical for business accounts |
| Good | 3% – 6% | Strong content strategy |
| Excellent | 6%+ | Exceptional content and community |
Caveat: Engagement is a vanity metric unless you trace it to patient acquisition. Track leads and patients from social media, not just likes. Use your hashtag strategy, content ideas, and social media calendar to drive engagement that converts.
23. Email Marketing Metrics
What to track:
| Metric | Benchmark | Action If Below |
|---|---|---|
| Open rate | 25% – 40% | Improve subject lines, clean list |
| Click rate | 2% – 5% | Better content, clearer CTAs |
| Revenue per email | $0.50 – $2.00 | Segment list, personalize offers |
| Unsubscribe rate | Under 0.5% | Reduce frequency, improve relevance |
For email strategy, see our med spa email marketing guide and newsletter guide.
24. SEO Metrics
| Metric | Target | Tracking Tool |
|---|---|---|
| Organic sessions/month | 500+ (growing) | Google Analytics |
| Keywords in top 20 | 20+ | Ahrefs, Google Search Console |
| Domain authority | Growing quarter over quarter | Ahrefs |
| Local pack appearances | Top 3 for core keywords | Google Search Console |
See our SEO checklist and local SEO guide for strategies.
25. Paid Media Metrics
| Metric | Google Ads Target | Meta Ads Target |
|---|---|---|
| CTR | 5%+ | 1.5%+ |
| Quality Score | 7+ | N/A (relevance score 7+) |
| Conversion rate | 8-15% | 2-5% |
| ROAS | 5:1+ | 4:1+ |
| Impression share | 60%+ for core keywords | N/A |
Building Your Med Spa Dashboard
Tracking 25 KPIs sounds overwhelming. It is not — if you build a system with the right frequency.
The Weekly Dashboard (5 Minutes)
Track these every Monday morning:
| Metric | Source | What You Are Looking For |
|---|---|---|
| Total revenue (vs. same week last year) | POS/EMR | Trend direction |
| New patient volume | CRM | Pipeline health |
| Schedule utilization | Booking system | Capacity gaps |
| No-show/cancellation rate | Booking system | Revenue leakage |
The Monthly Dashboard (30 Minutes)
Track these on the 1st of each month:
| Category | Metrics to Review |
|---|---|
| Financial | Revenue, revenue per provider hour, revenue per visit, gross margin, net margin |
| Acquisition | Lead volume by channel, CPL, CPA, lead-to-patient rate |
| Retention | Retention rate, rebooking rate, membership rate |
| Marketing | Website conversion rate, GBP metrics, social engagement, email metrics |
The Quarterly Dashboard (2 Hours)
Review these every quarter with your leadership team:
| Category | Metrics to Review |
|---|---|
| Strategic | Patient LTV (updated), marketing ROI by channel, NPS trend, staff productivity |
| Diagnostic | Year-over-year comparisons, service mix profitability analysis |
| Planning | Channel budget reallocation, staffing needs, marketing calendar adjustments |
Tools for Tracking
| Purpose | Tool Options | Monthly Cost |
|---|---|---|
| EMR/POS reporting | Jane, AestheticsPro, PatientNow, Nextech | $200-$500 |
| Google Analytics + GSC | Google (free) | $0 |
| Ad platform dashboards | Google Ads, Meta Ads | $0 |
| CRM | GoHighLevel, HubSpot, Salesforce | $97-$497 |
| Custom dashboard | Google Sheets, Looker Studio, Databox | $0-$200 |
| Call tracking | CallRail, CallTrackingMetrics | $50-$200 |
Implementation step: Start with Google Sheets. Create a single spreadsheet with tabs for weekly, monthly, and quarterly metrics. Input data manually for the first 3 months. Then automate as you identify which integrations are worth the cost. See our management software guide for tool comparisons.
The Diagnostic Framework: What to Do When KPIs Are Off
The value of KPIs is not in the numbers themselves — it is in the decisions they drive. Here is the diagnostic framework that connects symptoms to causes and actions.
Revenue Diagnostics
| Symptom | Likely Cause | Investigation | Fix |
|---|---|---|---|
| Revenue down + new patients steady | Retention problem | Check retention rate, rebooking rate | Improve post-treatment experience, launch membership |
| Revenue steady + new patients declining | Acquisition problem | Review channel performance, creative fatigue | Refresh marketing, test new channels |
| Revenue up + margin down | Cost problem | Analyze COGS, payroll, overhead trends | Renegotiate vendor pricing, review staffing |
| Revenue seasonal but deeper than expected | Market or competitive shift | Check competitor activity, market demand data | Adjust marketing calendar, seasonal campaigns |
Marketing Diagnostics
| Symptom | Likely Cause | Investigation | Fix |
|---|---|---|---|
| High CPL + high conversion | Targeting too narrow | Review audience settings, keyword match types | Broaden targeting while maintaining quality |
| Low CPL + low conversion | Quality problem | Review lead sources, landing page quality | Improve messaging, tighten targeting |
| High impressions + low CTR | Ad copy problem | Review ad creative, headlines, offers | Test new creative, improve offer |
| High CTR + low conversion | Landing page problem | Review landing page experience, form friction | Optimize landing page, reduce form fields |
| High leads + low bookings | Follow-up problem | Check speed-to-lead, call recordings | Train front desk, automate follow-up |
Operational Diagnostics
| Symptom | Likely Cause | Investigation | Fix |
|---|---|---|---|
| High utilization + low revenue/hour | Pricing problem | Compare rates to market, analyze service mix | Raise prices, shift to higher-value treatments |
| Low utilization + adequate marketing | Booking friction or scheduling mismatch | Review booking process, day/time availability | Simplify booking, adjust schedule to demand |
| High no-show rate | Insufficient reminders or no deposit | Check reminder system, deposit policy | Implement automated reminders, require deposits |
| Low NPS despite good outcomes | Experience gap | Review wait times, staff interactions, environment | Upgrade interior, train staff on patient experience |
Common Med Spa Metrics Tracking Mistakes
Mistake 1: Tracking Too Many Metrics
Impact: Data paralysis — too much information prevents action
Fix: Start with the 4 weekly metrics. Add monthly metrics after 30 days. Add quarterly after 90 days. You can always add more — but starting with 25 metrics at once guarantees you will abandon the process within a month.
Mistake 2: Tracking Vanity Metrics
Impact: Feeling good about numbers that do not impact revenue
Fix: Every metric you track should connect to a revenue or operational decision. Social media followers do not matter unless they convert to patients. Website traffic does not matter unless it generates leads. If a metric does not inform an action, stop tracking it.
Mistake 3: Not Benchmarking Against Yourself
Impact: External benchmarks are useful, but your own trends matter more
Fix: After 3 months of tracking, your own historical data becomes your most valuable benchmark. A conversion rate improving from 18% to 25% is a win — even if the "industry benchmark" is 30%. Track trends, not just snapshots.
Mistake 4: No Attribution System
Impact: Cannot determine which marketing drives which patients
Fix: Implement: UTM tracking on all campaigns, call tracking numbers by channel, "how did you hear about us?" in your intake form, and CRM pipeline tracking. Attribution is imperfect, but imperfect data is infinitely better than no data.
Mistake 5: Acting on Weekly Fluctuations
Impact: Constant strategy changes that prevent any approach from working
Fix: Weekly data identifies acute issues (schedule gaps, sudden no-show spikes). Monthly data identifies trends. Quarterly data drives strategic decisions. Never change your marketing strategy based on one week of data.
Frequently Asked Questions
What are the most important KPIs for a new med spa? Focus on five metrics in your first 6 months: total revenue, new patient volume, cost per acquisition, consultation-to-treatment conversion rate, and patient retention rate (starting at month 4). These tell you whether you are filling your calendar, at what cost, and whether patients are staying. Add additional metrics as your systems mature.
How often should I review my KPIs? Weekly for the 4 core metrics (5 minutes). Monthly for the full operational and marketing dashboard (30 minutes). Quarterly for strategic metrics and year-over-year analysis (2 hours). Annual for a comprehensive business review with goal-setting.
What is a good patient lifetime value for a med spa? $4,000-$8,000 is the "good" range. Practices with strong membership programs and retention systems regularly achieve $8,000+. If your LTV is below $2,000, you likely have a retention problem — patients are not returning after their first visit.
How do I calculate marketing ROI accurately? Track from ad click through to patient revenue using UTM parameters, call tracking, and CRM pipeline data. Calculate first-visit ROAS immediately, then update to 12-month ROAS as patient spend data accumulates. See our marketing ROI guide for the complete formula.
What KPI tool is best for med spas? Start with Google Sheets (free, flexible). Graduate to Looker Studio (free, connects to GA4/Google Ads) or Databox ($72/month, pre-built healthcare dashboards) when you want automated reporting. Your CRM should handle lead and pipeline metrics natively.
Measure What Matters, Then Act
Med spa KPIs are only valuable if they lead to action. The practices we work with do not just track med spa performance indicators — they use medical spa analytics to make marketing decisions, operational changes, and strategic pivots every month.
The med spa metrics framework in this guide gives you the numbers. The benchmarks give you targets. The diagnostic framework tells you what to fix and in what order. What remains is execution — consistently tracking, analyzing, and acting on the data every week.
If your KPIs are telling you that marketing is the bottleneck — patient acquisition costs are too high, lead volume is too low, or conversion rates are declining — that is the problem we solve. Exclusively for med spas.
We do not guess at what might work. We look at your data, identify the highest-impact opportunities, and build marketing systems that move the specific metrics holding your practice back. Every recommendation is data-backed. Every strategy is measurable. Every result is trackable.